测试服务器(或虚拟机)的QPS峰值
利用sysbench压测工具模拟SELECT操作
# 已有test库的话先drop掉 drop database test; create database test; # prepare准备阶段,构建压测环境 sysbench /usr/local/share/sysbench/tests/include/oltp_legacy/select.lua \ --oltp-table-size=20000 --mysql-table-engine=innodb --db-driver=mysql \ --mysql-user=root --mysql-password=root123 --mysql-port=3306 \ --mysql-host=10.245.231.202 --mysql-db=test \ --events=0 --time=60 --oltp-tables-count=20 --report-interval=10 --threads=2 prepare # 开始压测 sysbench /usr/local/share/sysbench/tests/include/oltp_legacy/select.lua \ --oltp-table-size=20000 --mysql-table-engine=innodb --db-driver=mysql \ --mysql-user=root --mysql-password=root123 --mysql-port=3306 \ --mysql-host=10.245.231.202 --mysql-db=test \ --events=0 --time=60 --oltp-tables-count=20 --report-interval=10 --threads=2 run sysbench 1.0.5 (using bundled LuaJIT 2.1.0-beta2) Running the test with following options: Number of threads: 2 Report intermediate results every 10 second(s) Initializing random number generator from current time Initializing worker threads... Threads started! [ 10s ] thds: 2 tps: 8087.29 qps: 8087.29 (r/w/o: 8087.29/0.00/0.00) lat (ms,95%): 0.34 err/ s: 0.00 reconn/s: 0.00 [ 20s ] thds: 2 tps: 6949.28 qps: 6949.28 (r/w/o: 6949.28/0.00/0.00) lat (ms,95%): 0.35 err/ s: 0.00 reconn/s: 0.00 [ 30s ] thds: 2 tps: 7251.71 qps: 7251.71 (r/w/o: 7251.71/0.00/0.00) lat (ms,95%): 0.34 err/ s: 0.00 reconn/s: 0.00 [ 40s ] thds: 2 tps: 6927.19 qps: 6927.19 (r/w/o: 6927.19/0.00/0.00) lat (ms,95%): 0.35 err/ s: 0.00 reconn/s: 0.00 [ 50s ] thds: 2 tps: 7387.64 qps: 7387.64 (r/w/o: 7387.64/0.00/0.00) lat (ms,95%): 0.32 err/ s: 0.00 reconn/s: 0.00 [ 60s ] thds: 2 tps: 10171.21 qps: 10171.21 (r/w/o: 10171.21/0.00/0.00) lat (ms,95%): 0.26 err/ s: 0.00 reconn/s: 0.00 SQL statistics: queries performed: read: 467780 write: 0 other: 0 total: 467780 transactions: 467780 (7795.29 per sec.) queries: 467780 (7795.29 per sec.) ignored errors: 0 (0.00 per sec.) reconnects: 0 (0.00 per sec.) General statistics: total time: 60.0008s total number of events: 467780 Latency (ms): min: 0.11 avg: 0.25 max: 27.63 95th percentile: 0.34 sum: 119092.82 Threads fairness: events (avg/stddev): 233890.0000/242.00 execution time (avg/stddev): 59.5464/0.00 |
使用orzdba工具实际查看
[mysql@mydb1 ~]$ ./orzdba -lazy .=================================================. | Welcome to use the orzdba tool ! | | Yep...Chinese English~ | '=============== Date : 2017-08-20 ===============' HOST: mydb1 IP: 10.245.231.202 DB : lyj|performance_schema Var : port[3306] read_only[OFF] version[5.6.35-log] binlog_format[ROW] max_binlog_cache_size[4G] max_binlog_size[500M] max_connect_errors[100] max_connections[214] max_user_connections[2800] open_files_limit[1024] sync_binlog[100] table_definition_cache[600] table_open_cache[400] thread_cache_size[10] innodb_adaptive_flushing[ON] innodb_adaptive_hash_index[ON] innodb_buffer_pool_instances[8] innodb_buffer_pool_size[4G] innodb_file_per_table[ON] innodb_flush_log_at_trx_commit[1] innodb_flush_method[O_DIRECT] innodb_io_capacity[1000] innodb_lock_wait_timeout[10] innodb_log_buffer_size[64M] innodb_log_file_size[1000M] innodb_log_files_in_group[4] innodb_max_dirty_pages_pct[60] innodb_open_files[400] innodb_read_io_threads[4] innodb_stats_on_metadata[OFF] innodb_thread_concurrency[0] innodb_write_io_threads[10] -------- -----load-avg---- ---cpu-usage--- ---swap--- -QPS- -TPS- -Hit%- ------threads------ time | 1m 5m 15m |usr sys idl iow| si so| ins upd del sel iud| lor hit| run con cre cac| 15:51:25| 0.07 0.04 0.05| 0 0 100 0| 0 0| 0 0 0 0 0| 0 100.00| 0 0 0 0| 15:51:28| 0.14 0.06 0.05| 8 2 90 0| 0 0| 0 0 0 7178 0| 15417 100.00| 3 4 0 0| 15:51:31| 0.13 0.06 0.05| 6 3 91 0| 0 0| 0 0 0 6757 0| 14528 100.00| 4 4 0 0| 15:51:34| 0.13 0.06 0.05| 7 2 91 0| 0 0| 0 0 0 6679 0| 14342 100.00| 4 4 0 0| 15:51:37| 0.12 0.06 0.05| 7 3 90 0| 0 0| 0 0 0 7569 0| 16285 100.00| 2 4 0 0| 15:51:40| 0.12 0.06 0.05| 8 2 90 0| 0 0| 0 0 0 7298 0| 15707 100.00| 3 4 0 0| 15:51:43| 0.19 0.07 0.06| 8 2 90 0| 0 0| 0 0 0 7668 0| 16498 100.00| 2 4 0 0| 15:51:46| 0.18 0.07 0.06| 8 2 91 0| 0 0| 0 0 0 9787 0| 21050 100.00| 2 4 0 0| 15:51:49| 0.18 0.07 0.06| 8 2 91 0| 0 0| 0 0 0 11045 0| 23759 100.00| 2 4 0 0| 15:51:52| 0.24 0.09 0.06| 8 2 90 0| 0 0| 0 0 0 9709 0| 20881 100.00| 2 4 0 0| # 从上面可以看出QPS峰值大约在1万 |
利用ZABBIX监控工具观察QPS
zabbix自带的mysql模板共可监测以下14项,图形化查看方法如下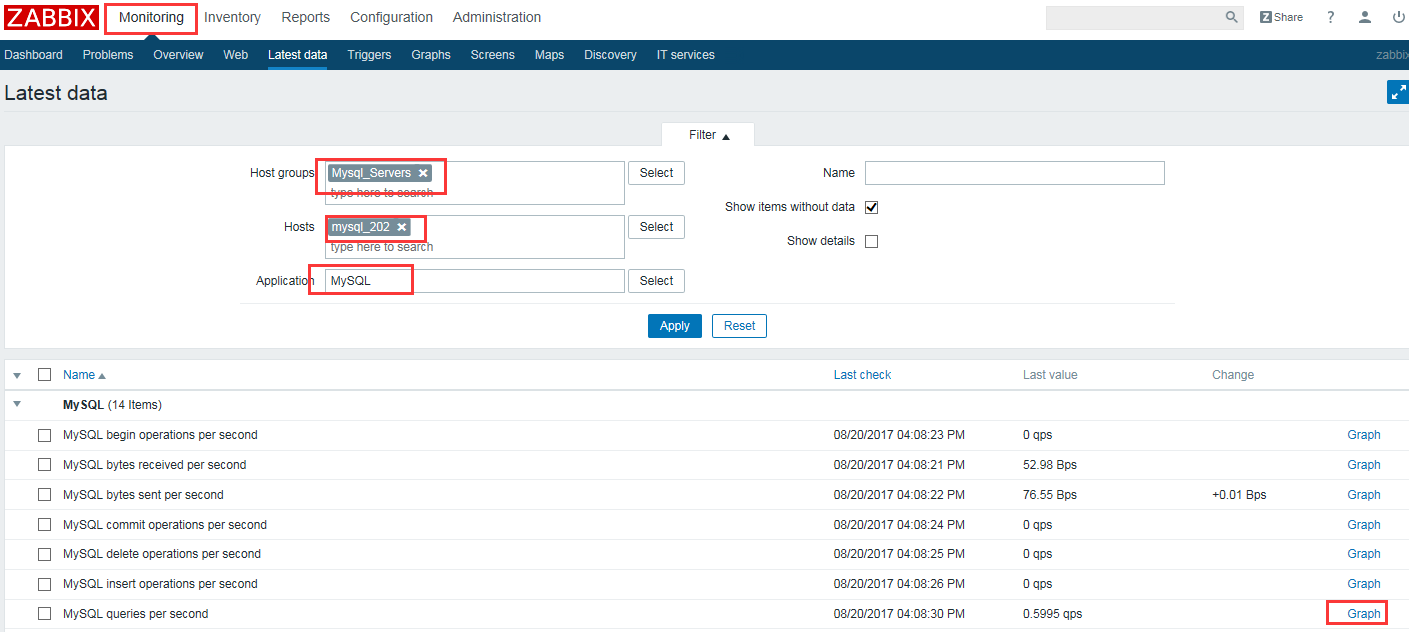
点”MySQL queries per second”项的Graph”就可以图形化观察QPS了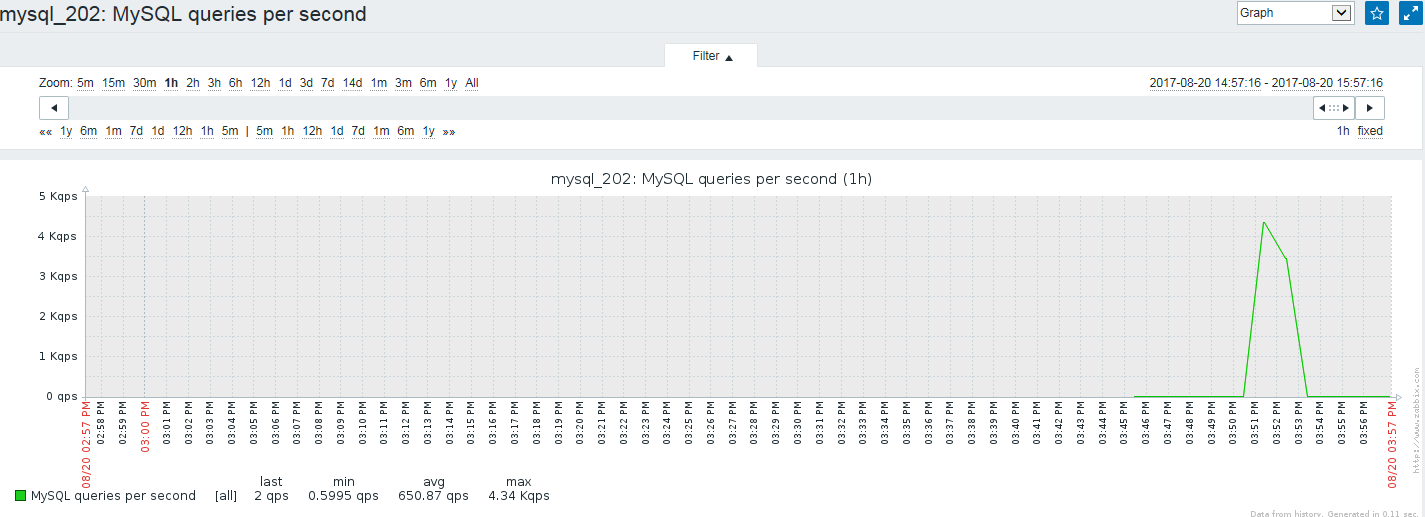
重现MySQL主从复制延迟的场景
查看主从库状态
比较主库的Position和从库的Read_Master_Log_Pos和Exec_Master_Log_Pos是不是相同,以下相同说明没有延迟# 主库状态
mysql> show master status\G;
*************************** 1. row ***************************
File: binlog.000031
Position: 458032215
Binlog_Do_DB:
Binlog_Ignore_DB:
Executed_Gtid_Set:
1 row in set (0.00 sec)
# 从库状态
mysql> show slave status\G;
*************************** 1. row ***************************
Slave_IO_State: Waiting for master to send event
Master_Host: 10.245.231.202
Master_User: rep
Master_Port: 3306
Connect_Retry: 60
Master_Log_File: binlog.000031
Read_Master_Log_Pos: 458032215
Relay_Log_File: relaylog.000002
Relay_Log_Pos: 458032375
Relay_Master_Log_File: binlog.000031
Slave_IO_Running: Yes
Slave_SQL_Running: Yes
Replicate_Do_DB:
Replicate_Ignore_DB:
Replicate_Do_Table:
Replicate_Ignore_Table:
Replicate_Wild_Do_Table:
Replicate_Wild_Ignore_Table:
Last_Errno: 0
Last_Error:
Skip_Counter: 0
Exec_Master_Log_Pos: 458032215
Relay_Log_Space: 458032541
Until_Condition: None
Until_Log_File:
Until_Log_Pos: 0
Master_SSL_Allowed: No
Master_SSL_CA_File:
Master_SSL_CA_Path:
Master_SSL_Cert:
Master_SSL_Cipher:
Master_SSL_Key:
Seconds_Behind_Master: 0
Master_SSL_Verify_Server_Cert: No
Last_IO_Errno: 0
Last_IO_Error:
Last_SQL_Errno: 0
Last_SQL_Error:
Replicate_Ignore_Server_Ids:
Master_Server_Id: 101
Master_UUID: 337aaf35-1b73-11e7-8b30-005056a01c3e
Master_Info_File: /u01/data/3306/master.info
SQL_Delay: 0
SQL_Remaining_Delay: NULL
Slave_SQL_Running_State: Slave has read all relay log; waiting for the slave I/O thread to update it
Master_Retry_Count: 86400
Master_Bind:
Last_IO_Error_Timestamp:
Last_SQL_Error_Timestamp:
Master_SSL_Crl:
Master_SSL_Crlpath:
Retrieved_Gtid_Set:
Executed_Gtid_Set:
Auto_Position: 0
1 row in set (0.00 sec)
用sysbench工具做大批量的insert
# 创建数据库 mysql> drop database lyj; mysql> create database lyj; # 用sysbench工具准备测试环境 sysbench /usr/local/share/sysbench/tests/include/oltp_legacy/insert.lua \ --oltp-table-size=1000000 --mysql-table-engine=innodb --db-driver=mysql \ --mysql-user=root --mysql-password=root123 --mysql-port=3306 \ --mysql-host=10.245.231.202 --mysql-db=lyj \ --events=0 --time=60 --oltp-tables-count=2 --report-interval=10 --threads=2 prepare |
查看从库状态
在insert过程中,从库的Read_Master_Log_Pos和Exec_Master_Log_Pos出现不相同现象,表明MySQL主从复制有延迟mysql> show slave status\G;
*************************** 1. row ***************************
Slave_IO_State: Queueing master event to the relay log
Master_Host: 10.245.231.202
Master_User: rep
Master_Port: 3306
Connect_Retry: 60
Master_Log_File: binlog.000031
Read_Master_Log_Pos: 524289249
Relay_Log_File: relaylog.000002
Relay_Log_Pos: 458032683
Relay_Master_Log_File: binlog.000031
Slave_IO_Running: Yes
Slave_SQL_Running: Yes
Replicate_Do_DB:
Replicate_Ignore_DB:
Replicate_Do_Table:
Replicate_Ignore_Table:
Replicate_Wild_Do_Table:
Replicate_Wild_Ignore_Table:
Last_Errno: 0
Last_Error:
Skip_Counter: 0
Exec_Master_Log_Pos: 458032523
Relay_Log_Space: 524289857
Until_Condition: None
Until_Log_File:
Until_Log_Pos: 0
Master_SSL_Allowed: No
Master_SSL_CA_File:
Master_SSL_CA_Path:
Master_SSL_Cert:
Master_SSL_Cipher:
Master_SSL_Key:
Seconds_Behind_Master: 22
Master_SSL_Verify_Server_Cert: No
Last_IO_Errno: 0
Last_IO_Error:
Last_SQL_Errno: 0
Last_SQL_Error:
Replicate_Ignore_Server_Ids:
Master_Server_Id: 101
Master_UUID: 337aaf35-1b73-11e7-8b30-005056a01c3e
Master_Info_File: /u01/data/3306/master.info
SQL_Delay: 0
SQL_Remaining_Delay: NULL
Slave_SQL_Running_State: Reading event from the relay log
Master_Retry_Count: 86400
Master_Bind:
Last_IO_Error_Timestamp:
Last_SQL_Error_Timestamp:
Master_SSL_Crl:
Master_SSL_Crlpath:
Retrieved_Gtid_Set:
Executed_Gtid_Set:
Auto_Position: 0